Your response is voluntary and any information we collect from you will be kept confidential.
Please read the informed consent document (click the button below) before you decide whether to participate.
Show Informed Consent Document
Welcome to a Survey on Graphical Inference
This web site is designed to conduct a series of three surveys on graphical inference which will help us understand human perception of graphics for use in communicating statistics. In this experiment, you will be guided through each of the three studies:Study 1 examines the ability to differentiate curves shown on charts and graphs (13 questions, about 15 minutes to complete).
Study 2 examines the ability to predict data by using your mouse to draw a trend line (12 questions, about 15 minutes to complete).
You may want a computer mouse handy for this study!

Study 3 examines graph comprehension of different types of charts and graphs (12 questions, about 15 minutes to complete).
Finally we would like to collect some information about you (age category, education, and gender).
Demographic Information
If you are not from prolific, please enter any text or number above.
Please fill out the demographic information to begin.
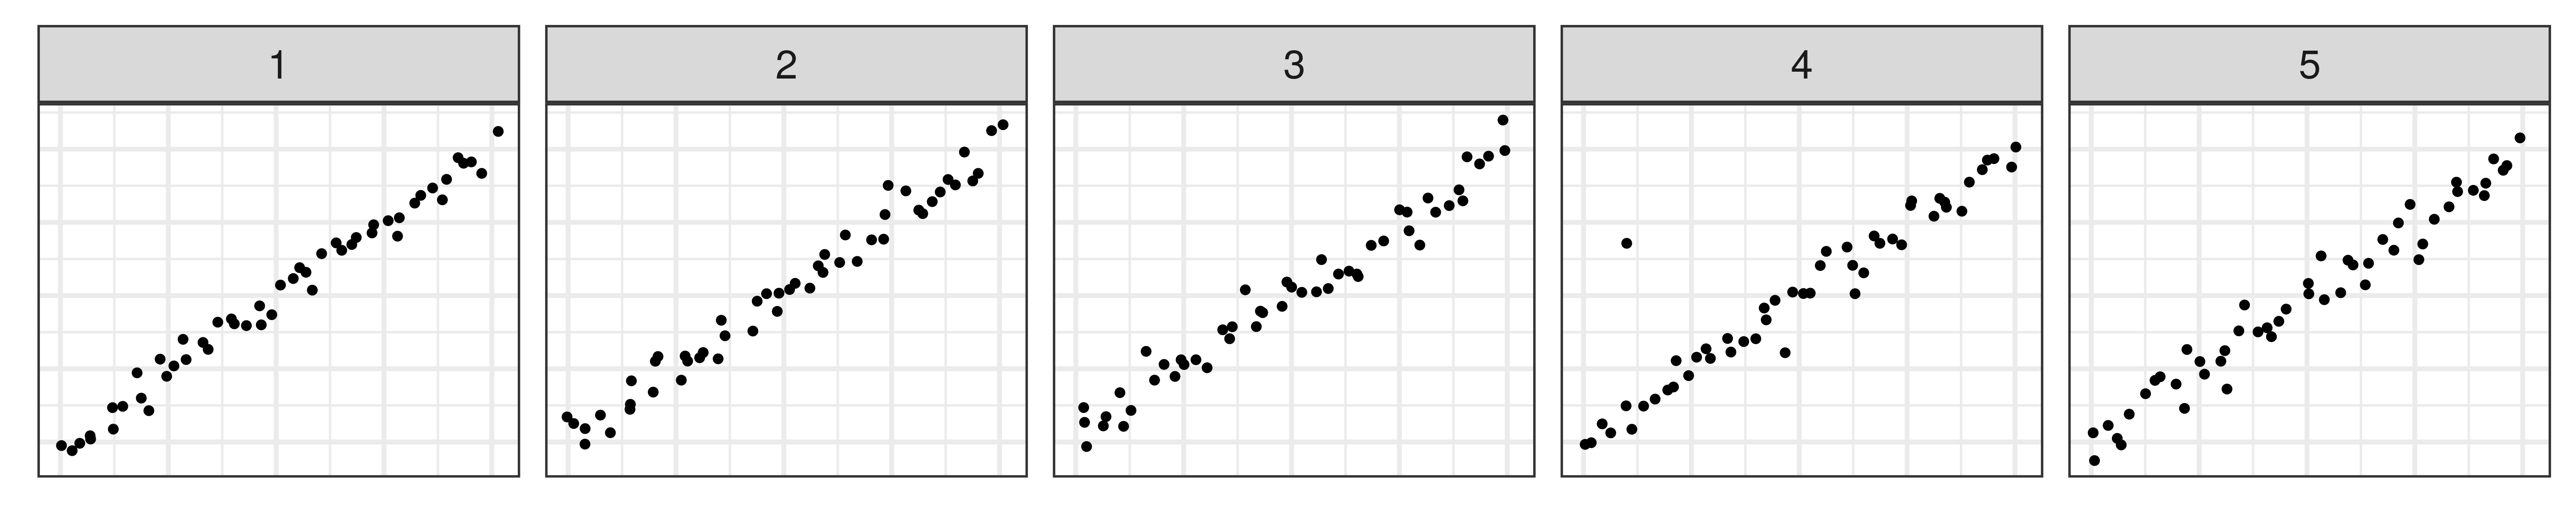
Study 1: Lineups
In this survey a series of similar looking charts will be presented. We would like you to respond to the following questions. 1. Pick the plot based on the survey question 2. Provide reasons for choice 3. How certain are you?Study 2: You Draw It
In this survey points following a trend will be shown. We would like you to finish drawing the trend for the light yellow box using your mouse.
Study 3: Estimation
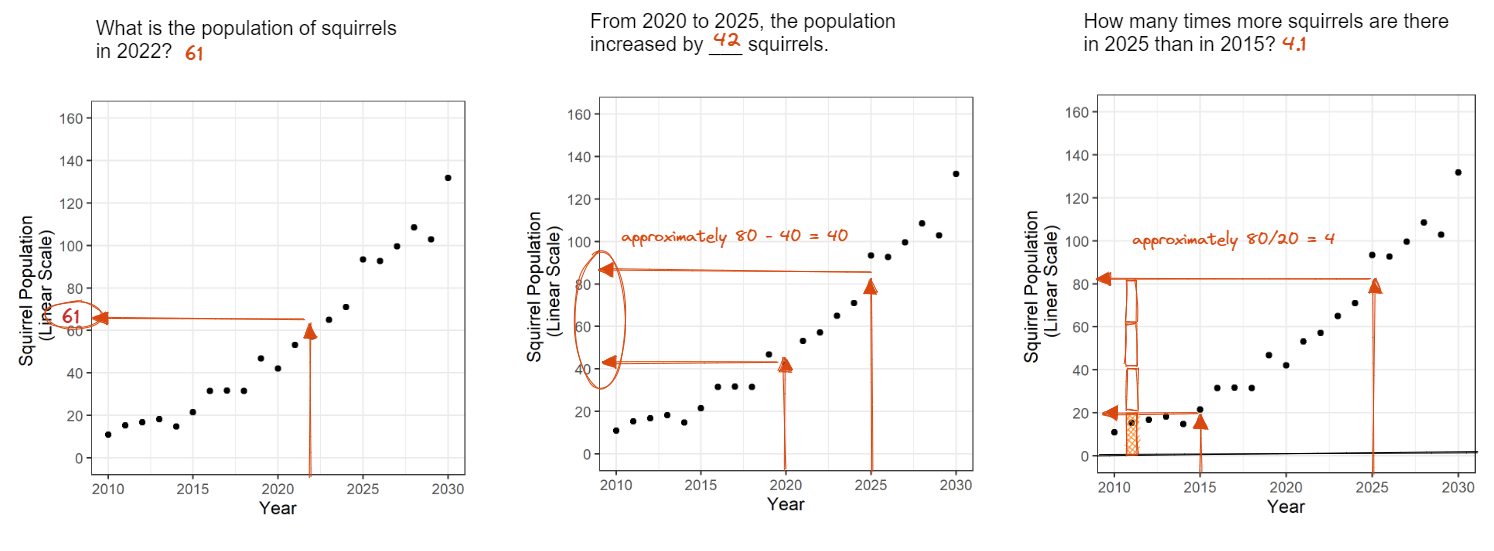
In this survey, points following a trend will be shown. We would like you to provide estimated values for the associated questions.Example 1:
Recently, a flying squirrel population was discovered on a college campus. The squirrel population on campus is illustrated in the graph. We need your help answering a few questions regarding the population of flying squirrels on campus.
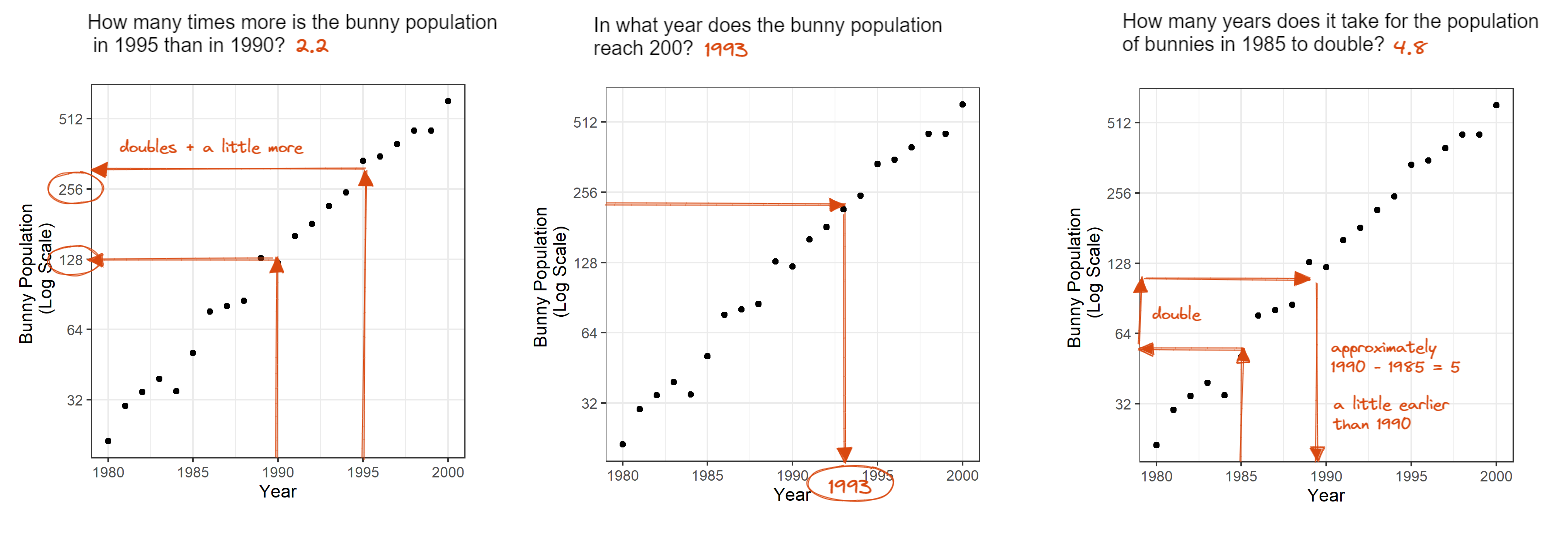
Example 2:
After winter, bunnies began inhabiting a valley. The bunny population in the valley is illustrated in the graph. We need your help answering a few questions regarding the population of bunnies in the valley.